Darrell Markewitz, with contributions by Neil Peterson
Peterson generated the various graphs seen in this section
Part Two : WIND
‘ The recent acquisition of a high quality air
flow meter allowed for precise and frequent measurements of the
actual 'in line' delivery of air into the working furnace. A
by-pass system allowed for the shifting to human powered bellows
at a number of points, also with accurate recording of volumes
produced. ‘
The primary purpose for mounting the October 2021
experimental smelt was to study erosion of a clay wall smelting
furnace over an extended period of natural weathering. At the same
time, this smelt also presented an excellent opportunity to both
measure air volumes over the entire sequence of effective iron
production, but also to allow for the inclusion of shorter
measurements of volumes produced from a human powered bellows.
The major modern intrusion into a truly
historical process has been the use of various electric blowers for
air supply for the bulk of experimental work to this point. Of a
total of 90 smelts, 16 have used various Viking Age inspired bellows
types (4 with ‘blacksmith’ sized ; 11 with two different ‘smelting’
sized ; 1 using blacksmith sized linked by a bladder) (2-1) The
primary reason there has been a dependence on electric blowers is
the considerable labour requirement for human power. Past experience
has demonstrated that ideally a separate team of at least three
physically fit individuals is required just to operate the bellows,
working in roughly 5 minute long shifts. This rotation is required
to ensure consistent pumping action, at one stroke per second, with
no interruptions, over the 4 - 6 hours required for a full smelt
sequence. (2-2)
Although there were earlier measurements made of
air flow rates while using various types of equipment, the accuracy
was hampered by the limitations of the instruments used (primarily a
digital vane type wind speed gauge) (2-3) Actual volumes were
derived mathematically from air speed through pipe size (here 35
mm).
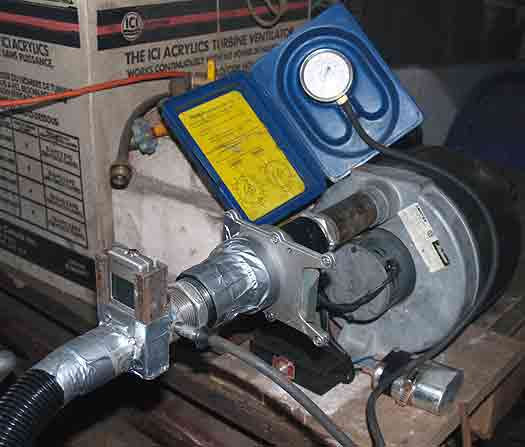
Figure 2-1 : Typical set up used to measure air flow. Wind speed gauge inserted downstream of the blast gate,
nipple for analog pressure gauge.
The numbers thus computed were transferred as
very rough 100 litre per minute (LpM) lines on to the simple siding
plate blast gate used to control air delivery from the standard
compressor blower (used consistently after Spring 2008) (2-4)). In
working practice, during a smelt more attention is paid to the
variations in charcoal burn rate, with air amounts changed to
establish an ‘ideal’ consumption of a fixed amount of charcoal over
time. (Largely based on accumulated experience : see ‘If you
don’t get any IRON’ )
Equipment and Set Up :
Primary research team member Neil Peterson
had acquired a considerably (!) more accurate air flow meter in
2020. The Omega HHF1000 flow meter will input it’s measurements
directly into a computer lap top, at increments far more precise
than needed for these tests. (2-5) The gauge was configured to
make four measurements every second (over this experiment, a total
of about 100,000 data points).
This instrument was first used briefly in
experiment # 89 - Phase 3B. (2-6) It was long understood that
‘available’ volume (from the blower) would not match actual ‘flow
through’ volume (into the furnace), both because of the constriction
of the contained charcoal and because conditions within an operating
furnace certainly change over time. Despite the few measurements
made during experiment # 89, it was clear that the blast gate
increments were indicating air amounts roughly 15 % higher than
actual flow volumes.
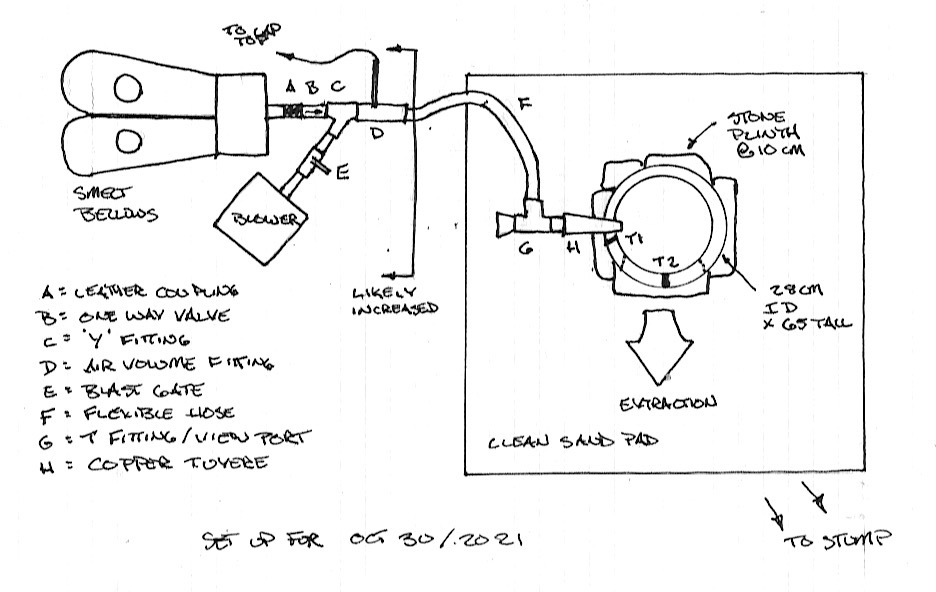
Figure 2-2 : Proposed equipment layout
The extraction phase of experiment # 89 had been
undertaken by relatively inexperienced hands, which in turn had
resulted in damage to the long used tuyere attachment fittings
(particularly the plexiglass viewing port). A complete set of new
fittings was created leading up to the October smelt. On the air
supply end, this included a Y branch that could be installed in the
piping. This had a one way valve attached to the secondary branch
(actually a ‘back up protector’ used with sump pumps). The existing
‘smelter bellows’ could thus be installed and left fixed in place.
With the air blast coming from the blower, there was only minimal
air loss as the one way valve was forced closed by the pressure. By
simply sliding the blast gate fully closed, only air produced by the
action of the bellows entered the system. Overall, there was found
to be negligible air loss through the various fittings, and because
the actual flow was being measured, these did not matter beyond
simple efficiency.
Figure 2-3 : Air supply fittings.
The bellows used here needs to be considered
speculative, in so much as no direct physical evidence for an actual
Viking Age bellows, specifically intended for supplying air into an
iron smelting furnace, is known.
This unit is based on the two known historic illustrations of
blacksmith’s equipment (there are no surviving artifacts), with
dimensions extended to allow for at least a *theoretical* delivery
volume in the range of 700 LpM (with 60 strokes per second). (2-7)
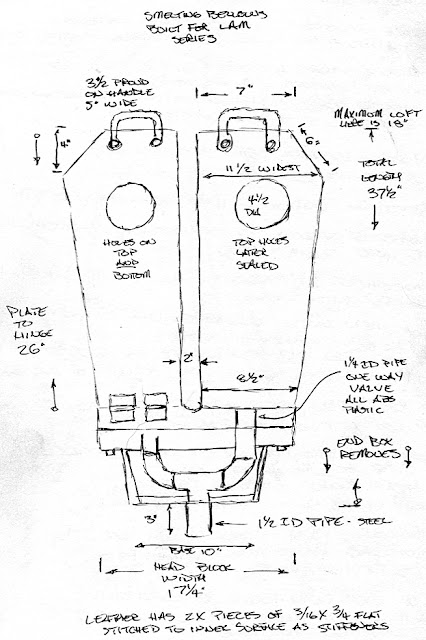
Figure 2-4 : Design
Drawing
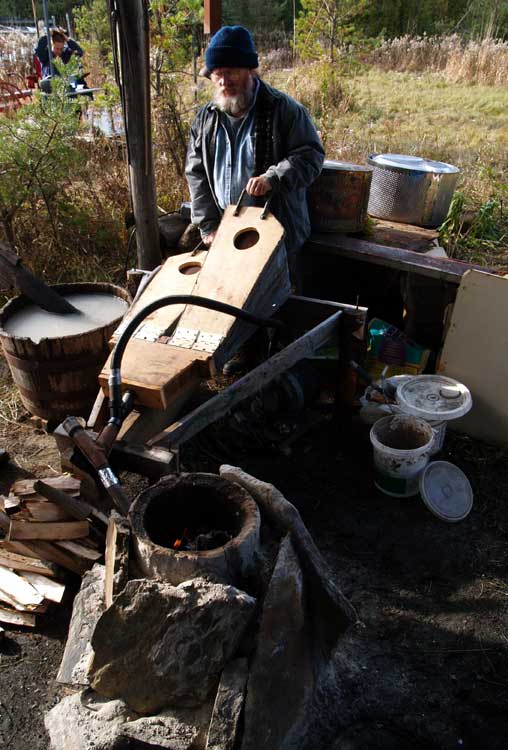
Figure 2-5 : Shown in
use, Ken Cook during Vinland 3, 2009
Norse Double Chamber Smelting Bellows
In actual practice, this set produced
significantly less air, down to the lower limits of what was
considered ideal for effective bloomery furnace function. (For a 28
cm diameter furnace, the ideal would be at least 740 LpM). A series
of earlier static tests
undertaken indicated an average air delivery with this bellows is in
the range of 650 LpM @ 60 stokes per minute, with the output into
open air. If the same variation in measuring accuracy is applied,
actual delivered volumes into the furnace would be expected to be
roughly 540 LpM @ 60 strokes per minute. In past experiments the
most obvious effect of the use of this bellows was a dramatic
reduction in furnace yields.
Taken together, the plan for # 90 was to :
Use the electric blower to supply air over the bulk of the
smelt.
The flow meter would constantly record, starting from the
first addition of charcoal (input to a lap top)
The (analog) pressure gauge would be noted and recorded at
each significant change to air volumes
There would be a number of diversions to use of the bellows,
each roughly a ten minute period, operation shared between the
three people available.
Furnace internal temperature measurements (considered less
important) would be undertaken several times.
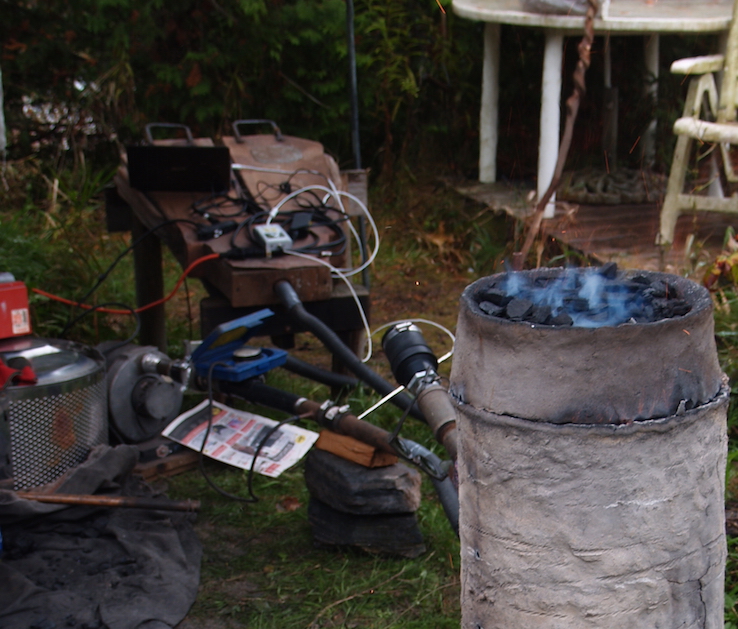
Figure 2-6 : Air systems and instrumentation in place,
early during the initial ‘ignition’ phase.
Looking at the Data :
During an actual smelt, the usual is to undertake
an activity first, then record the time and details. This means for
most even paced actions (like ore and charcoal charges) the accuracy
of recorded time points is typically rounded up or down to the
nearest minute. For more chaotic actions (clearing the tuyere or
tapping slag) the recorded time represents the completion of the
task, which itself may have taken several minutes to complete.
Obviously the flow meter, sending data to the computer file,
potentially allows for considerable more accuracy. The problem is
sorting through the huge number of individual data points available.
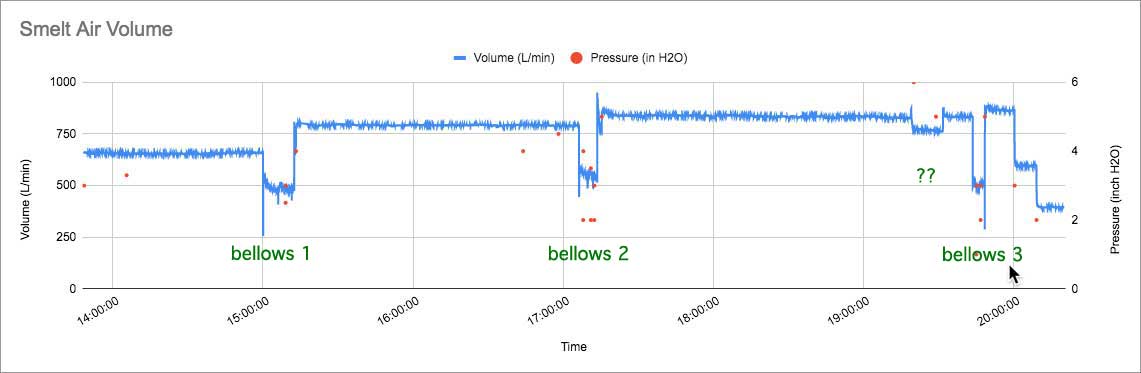
Graph 1 - Overall air flow over entire smelt sequence
A) The first overall look places actual flow
volumes against the major recorded events, primarily indicating
addition of charcoal at an average of about every 14 minutes. (see AIR-OVERALL) (2-9)
It would be expected that there would be
resistance to air flow caused by forcing the blast through the
stack, initially caused by the available spaces between individual
pieces of charcoal. During the main smelting sequence charcoal is
‘graded’ by breaking through a 2.5 cm grid, and screening out any
particles smaller than 6 mm. This size range is likely to change
within the burning process as individual particles fall downwards to
be consumed.
At first glance, the air volumes over time are
fairly stable, reflecting primarily major changes made in the
delivery at the blast gate :
Gate Marking
Flow Volume
(average)
Difference
800 LpM
655 LpM
82 %
900 LpM
795 LpM
88 %
1000 LpM
835 LpM
83 %
This indicates an average error from the plate
markings to the actual flow amounts of 84 %, which repeats the few
measurements undertaken during experiment # 89 (average difference
at 85 %.).
At the scale used above, the three periods where
bellows provided air supply are easy to see (and are marked on graph
1). There is a noticeable drop in air flow from 19:20 through 19:31
that does not match any observations in the written record.
B) The second question was how the amount of ore
present in the stack (above tuyere) might effect air volume, with
larger and larger amounts of ore are being added over the
progression of the smelt.
The 28 cm diameter by 60 cm tall stack has a
volume roughly equal to three standard charges of charcoal. This
means that at any given point. there should be roughly the last
three ore additions still dropping through the stack. This all
results in an ever increasing amount of ore present in the stack,
increasing during this experiment to as much as 6 kg present. (These
amounts indicated as ’Ore - in
Stack’.)
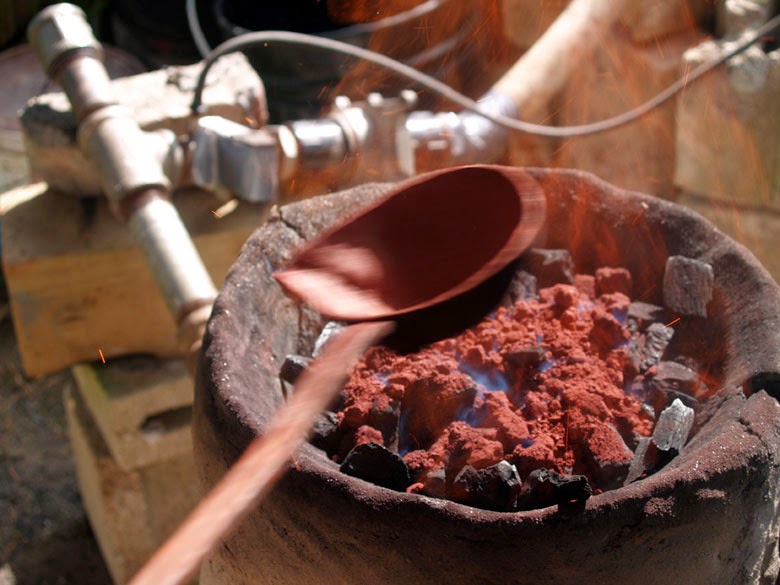
Figure 2-7 : New addition of analog added to the top of a
similar furnace
(smelt # 56, June 2014)
Ore is intentionally added evenly through
individual charcoal charges, this because the reduction is a gas
process, acting on the surface of individual ore particles. At least
as initially added, the ore ranges from roughly 6 to 20 mm sized
pieces, but with any resulting dust remaining included. One
important variable will be the type of ore, the analog being used
for these tests is composed of very fine oxide powder, loosely held
together in lumps. This is expected to quickly fragment back into
fine particles, and thus may not present much of a block to passage
of air through the charcoal.
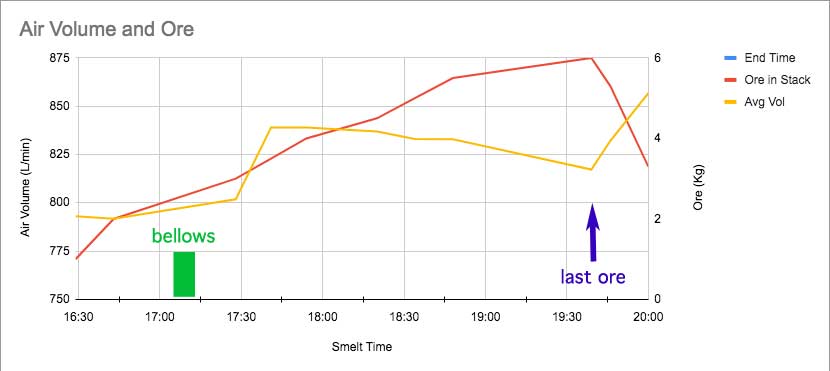
Graph 2 : Average air volumes and total ore in the stack, over
time
What the overview data shows is that the amount
of (at least this type) ore inside the stack does not greatly impact
on the air flow. At the start of the first ore addition, the flow is
recorded at 791 LpM, (blast gate at 900). There was use of bellows
from 1705 to 1713, and with the return to the blower the gate
setting was increased to 1000. There is a slight reduction seen in
the average flow of air as ore amounts increase, but even with a
lengthy duration of 6 kg ore amounts in the stack, this flow has
only dropped to 830 LpM (less than a 5 % reduction).
C) Was there any noticeable effect on air flow
due to slag, both in terms of its gradual accumulation and sudden
change in volume due to tapping?
This would take a much closer look at the
individual time point measurements, if for no other reason that
events like tapping were normally only noted as approximate times in
the overall sequence set. Slag management efforts are
indicated primarily via changes in sound, either distinctive noises
or more subtle reduction in loudness. The value of the viewing port
fitting becomes clear, as a visual check down the interior of the
tuyere confirms the nature of the blockage, with experience
determining the best course of action to remedy the problem.
Normally any visible sign that the slag has risen to 25 % of tuyere
opening is considered a point for intervention.
One clear indication of a potential problem is a
fluttering or thumping sound, caused when the level of the slag
rises enough that the air blast is essentially ‘blowing bubbles’
against the liquid slag formed at the tuyere tip. The solution is
always some method of lowering the interior slag ‘lake’. Judgment
always required, as the important function of the liquid inside the
slag bowl is to cover the developing bloom, protecting the iron from
destructive oxidation caused by exposure to the direct air blast.
Some amount of slag will need to be drained away, but just how this
is accomplished can vary depending on intended impact on the working
system inside the furnace. A typical slag tapping process only
requires a minute or two. Self taps often have a longer duration,
with a lower flow rate over the event.
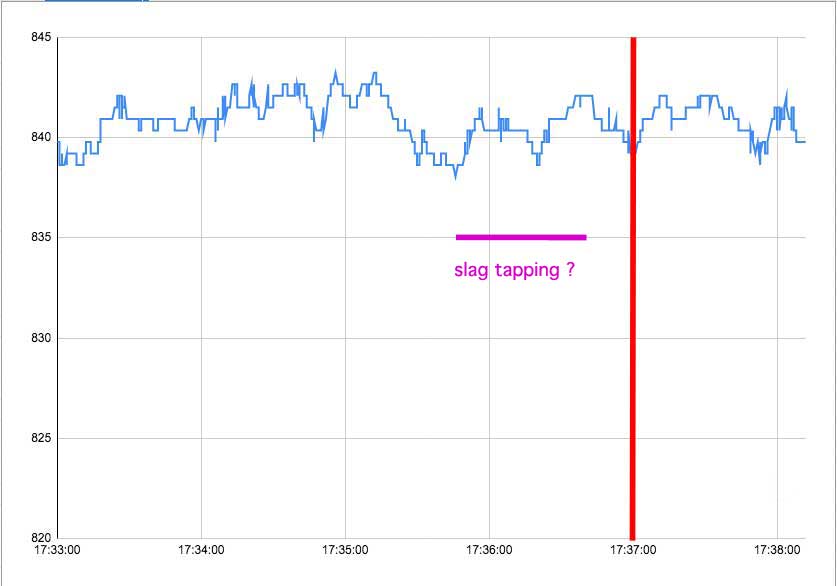
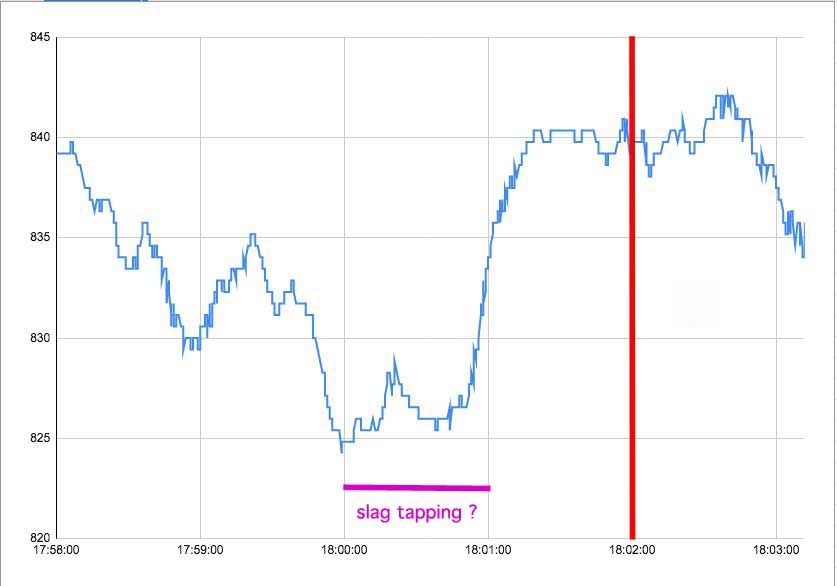
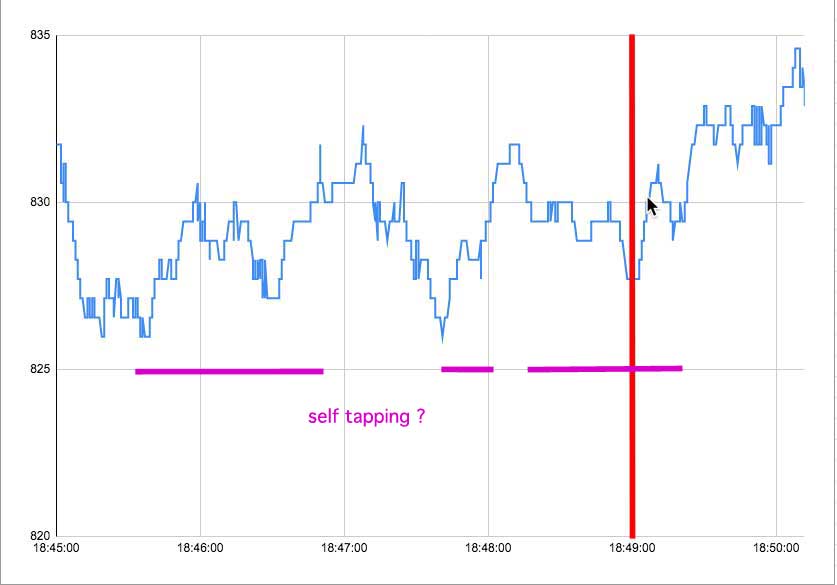
In this experiment there where four major slag
tapping events. Ending at approximate time points 17:37 and 18:02,
at the hands of the workers, with self taps caused by the dynamics
of the furnace itself ending at about 18:49 and 19:20.
The expected indication of a slag tapping event in the data would be
a fairly gradual reduction to the flow volume (as air is
increasingly needing to blow back the rising pool of slag), followed
by a fairly quick return to the original base rate.
The following graphs show recorded volumes inside
a five minute period, primarily before the time point indicated in
the sequence records (shown as the red bar) :
Graph 3 to 6 : Event time against air volumes.
Note enlargement of air scale for graph 4.
The graphs do not uniformly indicate the pattern
suggested above. For tap one and two, the operators first perceived
sounds indicating rising slag levels, which were confirmed by
observation down the tuyere.
Although there is an overall drop in air flow
recorded leading up to the tapping action, the difference in air
flow at the lowest point is seen as only a reduction of between 5
LpM (tap 1) to 22 LpM (tap 2). As this is a very slight amount
overall (only 1 - 3 %), this suggests a well experienced worker can
certainly perceive small changed air flow from sound alone. For tap
three, the changes are perhaps more typical of what can be expected
with a self tap, which usually involves a number of separate,
smaller leakages of liquid slag over a period of several minutes.
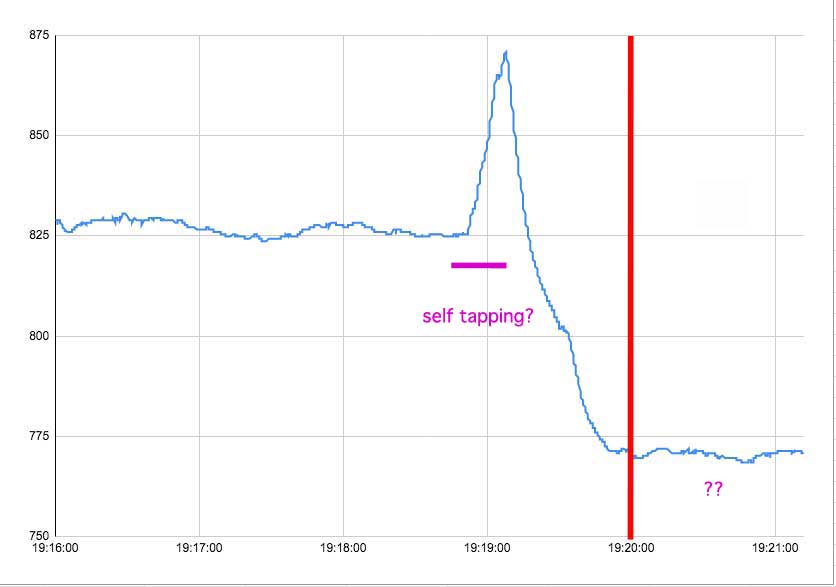
Tap four, again a self tap, is the puzzle. There
is the expected pattern of slight reduction in flow over time, then
a sudden increase in flow, as internal slag volume is reduced. What
is unexplained is the quick drop to a lower air flow level from 825
down to eventually 760, an 8 % change that persists for 11
minutes.
During this experiment, clearing accumulations of
solidified slag from the tuyere was not noted on the sequence
records. In any smelt, this process can normally be required to be
undertaken a number of times. The method involves removing the
viewing port / end cap, and quickly sealing the open pipe with a
gloved hand. A metal rod (‘radner’) is inserted through the fingers,
again attempting to keep any air from escaping. The radner is forced
down on to the congealed slag, braking it loose and pushing it back
into the furnace, a motion not requiring more than 2 - 5 seconds.
The rod is pulled clear, then the end cap replaced. Checking down
the now sealed view port, sometimes this process will be repeated,
if not all the encrusted slag is found to have been cleared.
The pipe fitting leading into the tuyere has an
ID of 35 mm. At the furnace end, the tuyere is 20 mm ID. The radner
used is a round profile rod at 10 mm (standard 3/8 inch). Very
roughly, this means that for the (short) time the rod is being
pushed through the tuyere tip, it will be blocking a further 25 % of
the cross section.
Against the quarter second per measurement of the
gauge, ideally this combined action should be visible, but without a
specific time point reference, is just too difficult to find inside
the mass of data.
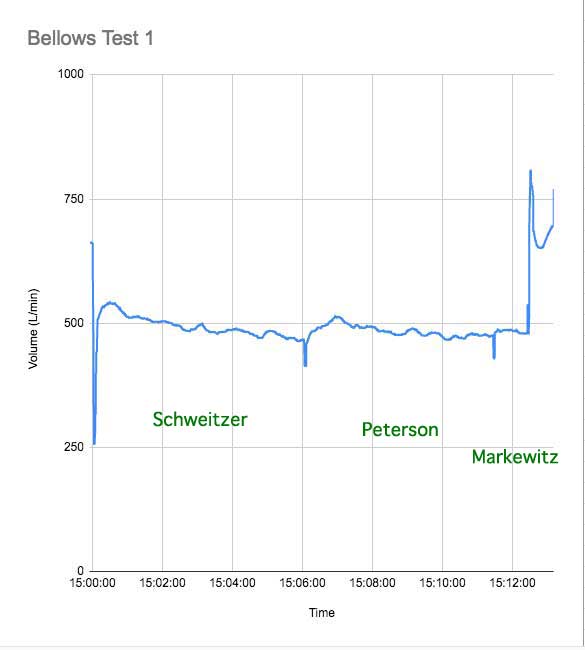
D) A major test for experiment # 90 was placing
the bellows as the working air supply. The same sequence of
operators was employed each time, Schweitzer / Peterson / Markewitz,
with differences in both individual duration and consistency
expected (largely due to differing body size, age, and overall
physical condition of each). No specific method was used to regulate
pumping rhythm, but the objective was for 60 strokes per minute. One
consideration is that the gauge was recording at 4 points per
minute, so would be unable at this setting to catch all the
variations during individual strokes.
TIME
OPERATOR
LENGTH
DELIVERY
% Added
15:00
Schweitzer
6
541
50%
15:06
Peterson
5
491
42%
15:11
Markewitz
1
477
8%
average
503
weighted
515
17:06
Schweitzer
4
549
57%
12:10
Peterson
2
559
29%
17:12
Markewitz
1
542
14%
average
550
weighted
551
19:44
Schweitzer
2
532
50%
19:46
Peterson
1
487
25%
19:47
Markewitz
1
501
25%
average
507
weighted
513
Overall
average
520
weighted
526
Table 2-1 : Bellows Air Delivery
‘Weighted’ gives an overall average, as
contributed by the individual operators (volume against time),
calculated to 526 LpM. This compares closely to the much earlier ‘no
load’ test and estimate (corrected at 540 LpM). Once again, actual
delivered amount is close to 30% below the ‘ideal’ for this furnace
(740 + LpM). (2-10)
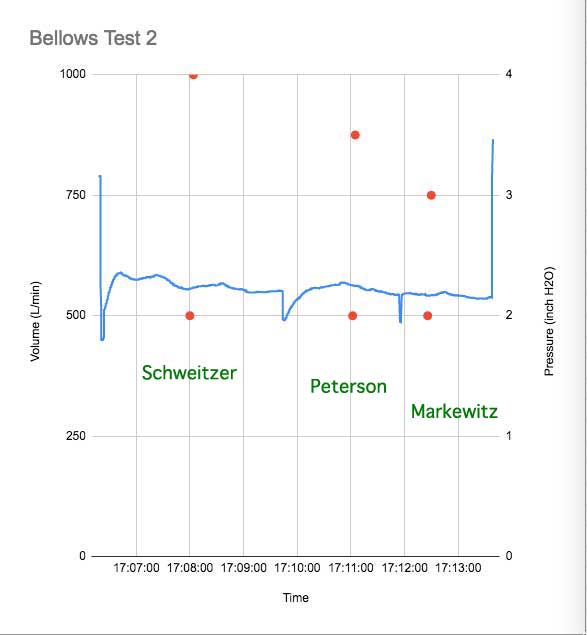
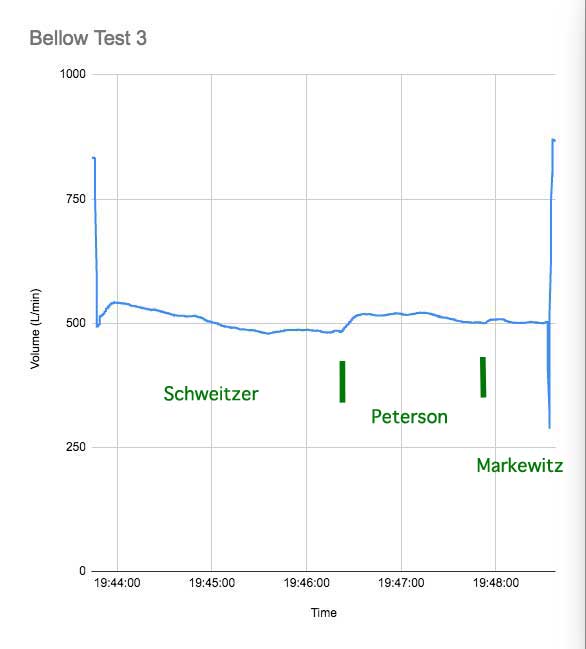
Looking at the flow volumes placed against time :
Graph 7 to 9 : Measured air delivery during bellows use,
individual operators indicated
In graph 7 and 8, the break in stroke pattern
signifying the change over in operators is quite clear, as is the
significant change in delivered volumes from that produced by the
electric blower (seen at either end). The lack of a sharp drop in
volume on graph 8 suggests a much more coordinated 'hand off'
between the operators.
Each operator is delivering different volumes. This will be
the net effect of both individual stroke rate, and also how much
force is delivered on each stroke. (In this case, differences in
physical ability, a result of body size / age / overall
fitness.)
There is a clear reduction in volumes over time, this due to
the increasing fatigue of each operator.
Although subtle in the graphs above, there is an indication
of the slightly different delivery between individual stokes.
There was known to be a difference in performance between the
two chambers (both from changing sound and difference in ‘feel’
during pumping). This should show in the raw data.
One simple application of all
these results would be to undertake test smelts reducing the
available electric blower air flow (as accurately measured) down
into the range possible via the use of the twin bellows.
Of course, a comparison of the blooms created
to the few known artifact blooms needs to be made. It may be that
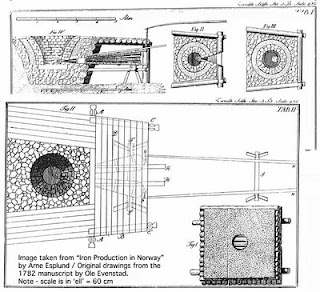
the current bellows design itself is the flaw. One
alternative, suggested by the Evenstad description (1782), is a
twin bellows design where the operator stands on top and ‘walks’
to drive the air against the return action of spring poles.
figure 2-8 : Ole Evenstad’s illustration of a
continuous process ‘traditional’ bloomery furnace from Norway. Of note is the pair of long, thin, bellows chambers,
operated from above. Taken from "Iron
Production in Norway During Two Millenia" by Arne
Espelund, 1995 (ISBN 82-992430-3-3)
Given the problem of recruiting a labour pool to
conduct a complete smelt employing human operated bellows, there has
been consideration of just how to construct a mechanically powered
alternative. An attempt was made in 2009 (Vinland 2) to build an
electrically powered box bellows, but the result proved over
complex, cumbersome, and in the end not especially effective. (So
much so that the device was named the ‘Fraken-Bellows’!).
Current thought is to replace the blast gate with a sliding plate,
driven by a small motor that can be regulated to provide variations
in both volume and ‘pulse’.
Ideally a test smelt would have provision for
more complete temperature measurements, sampling points not just up
and down the stack, but also across the furnace diameter.
One clear conclusion to be drawn is that far more
detailed event / sequence notes need to be taken, with careful
indication of exact times. Ideally there should be a dedicated
observer / record keeper who has the task of noting every action
undertaken. Over so many experiments, accumulated experience has
become a substitute for recording all observations possible, those
notes that are made are typically at best only accurate to ‘within a
minute’. These two factors combine to make it quite difficult to
spot specific changes in air flow, when that instrument is recording
at 240 data points per minute.
There is the possibility of a more detailed
academic study of the changes of air flow over time within a
complete bloomery iron smelt. This may suggest the content for the
next experiment, tentatively scheduled for later June in 2022.
2-2) See ‘An
Iron Smelt in Vinland’
It should be pointed out here that teams employing various ‘Great
Bellows’ designs (two stacked and interconnected chambers) are in
fact using a type that was not introduced until the 1300’s.
2-3) Earlier comparison of air delivery from various equipment can
be found : 'Air
Flow Rates’
2-4) The standard blower used since 2008 is the AMETEK #116246-04, a
high capacity, five stage (US Navy surplus) unit rated at 50 cubic
feet per minute / 1400 LpM
2-7) This unit was created for the ‘Vinland’ series 2009 - 2010. To
date, it has been used for a total of five complete smelt
experiments.
2-8) August 2008. A total of 11 individuals operated these bellows,
set without any loading. The average pump rate was 63 individual
strokes per second, an output of 675 LpM (measured via the wind
speed gauge). One important variable to this test was that the
bellows was not placed against a working furnace load.
See ‘Air
Delivery Test’ (blog post)
2-9) Key to the columns presented :
CLOCK = total event time in hours : minutes, with 12:00 set at
the start of the pre-heat fire
ELAPSED = time between individual charcoal additions
(effectively the burn rate)
AIR = from analog dial readings, centimetres of water column
(converted mathematically, originally in inches / water)
PLATE = based on markings on the blast gate, rough total
litres per minute (at best only accurate to about +/- 10 LpM)
GAGE = as inputed from the sensor, meters per second
VOLUME = calculated mathematically from gauge against pipe
diameter
ORE ADDED = individual additions of ore, complete at time
point, in kilograms
IN STACK = total amount of ore potentially contained in the
stack above tuyere (fuzzy estimate!)
2-10) Past experiments have resulted in a
significant reduction in produced yields in identical furnaces and
ore type and amounts, when these bellows have been used. There is
a question about the different quality of air delivery between the
constant flow from a blower and the ‘pulsing’ delivery from a twin
chamber bellows - and how this might effect the physical dynamics
inside the working furnace.